Data from Experiments
Data from Velocity Experiment
Data Table (showing distance, time and speed):
Data Table for Distance, Time and Speed for the Roller Coaster Experiment
| TOTAL DISTACES TRAVLED |
TIME |
SPEED |
| 10 |
.19 |
52.63 |
| 15 |
.24 |
62.63 |
| 25 |
.28 |
71.43 |
| 30 |
.31 |
78.13 |
|
35
|
.35 |
85.71 |
| 40 |
.38 |
92.11 |
| 45 |
.41 |
97.56 |
Graph (distance/time):

What does the distance/ time graph show about the velocity and acceleration for the roller coaster?
The marble is moving at a constant rate for the whole coaster. This means that the speed really never changes. It shows that it is moving at a consistent rate because it takes the same time to move from point A to point B.
Data from Energy Experiment
Potential Energy (define in your own words and give 2 examples):
Potential Energy is when an object has room to fall. The top half of Murdoch has potential energy because it can fall onto the 7/8 floor. Another object with potential energy is a binder on the table because it can fall to the floor of the room.
Kinetic Energy (define in your own words and give 2 examples):
Kinetic Energy is when an object is when an object is moving at a speed. An example is a car on a road because it is accelerating at a speed. Another example is a Zamboni on an ice rink because it is moving around the rink.
Diagram of Roller Coaster (showing highest/lowest Potential and Kinetic Energy):
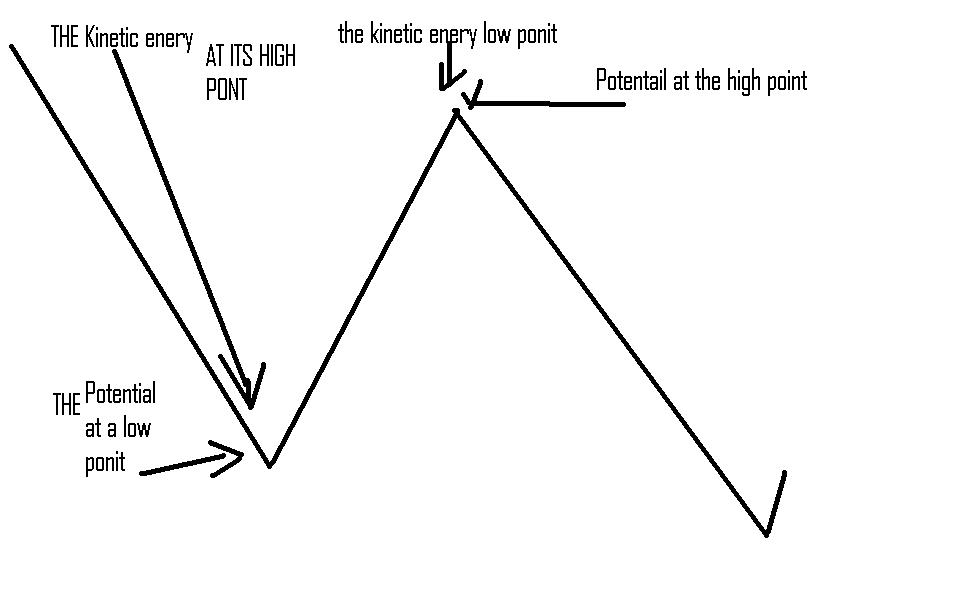
How do Potential and Kinetic Energies change throughout the course of the roller coaster?
The potential energy changes when the ball is at the top of one of the hills. And it is lower when it is at the bottom of a hill. Because at the top of the hill it has room to fall and when it is at the bottom of the hill it does not have room to fall.
The kinetic energy is at its highest point at the botom of the hill and it has the least kinetic energy at the top of the hills. This is because at the top of the hill it is going slower because it had to come up a steep path. On the way down it is rolling down so it picks up speed.
Comments (0)
You don't have permission to comment on this page.